
LivoPC Monitor
Play. Create. Work. Know your PC’s rhythm.
LivoPC Monitor, formerly LivoPC Connect, is the LivoPC app for tracking available CPU, GPU, RAM and temperature readings on Windows. See resource usage while gaming, coding or working. Use the local widget without an account and connect your PC to the website to view authorized history and plan upgrades.
Version 1.11 in certification
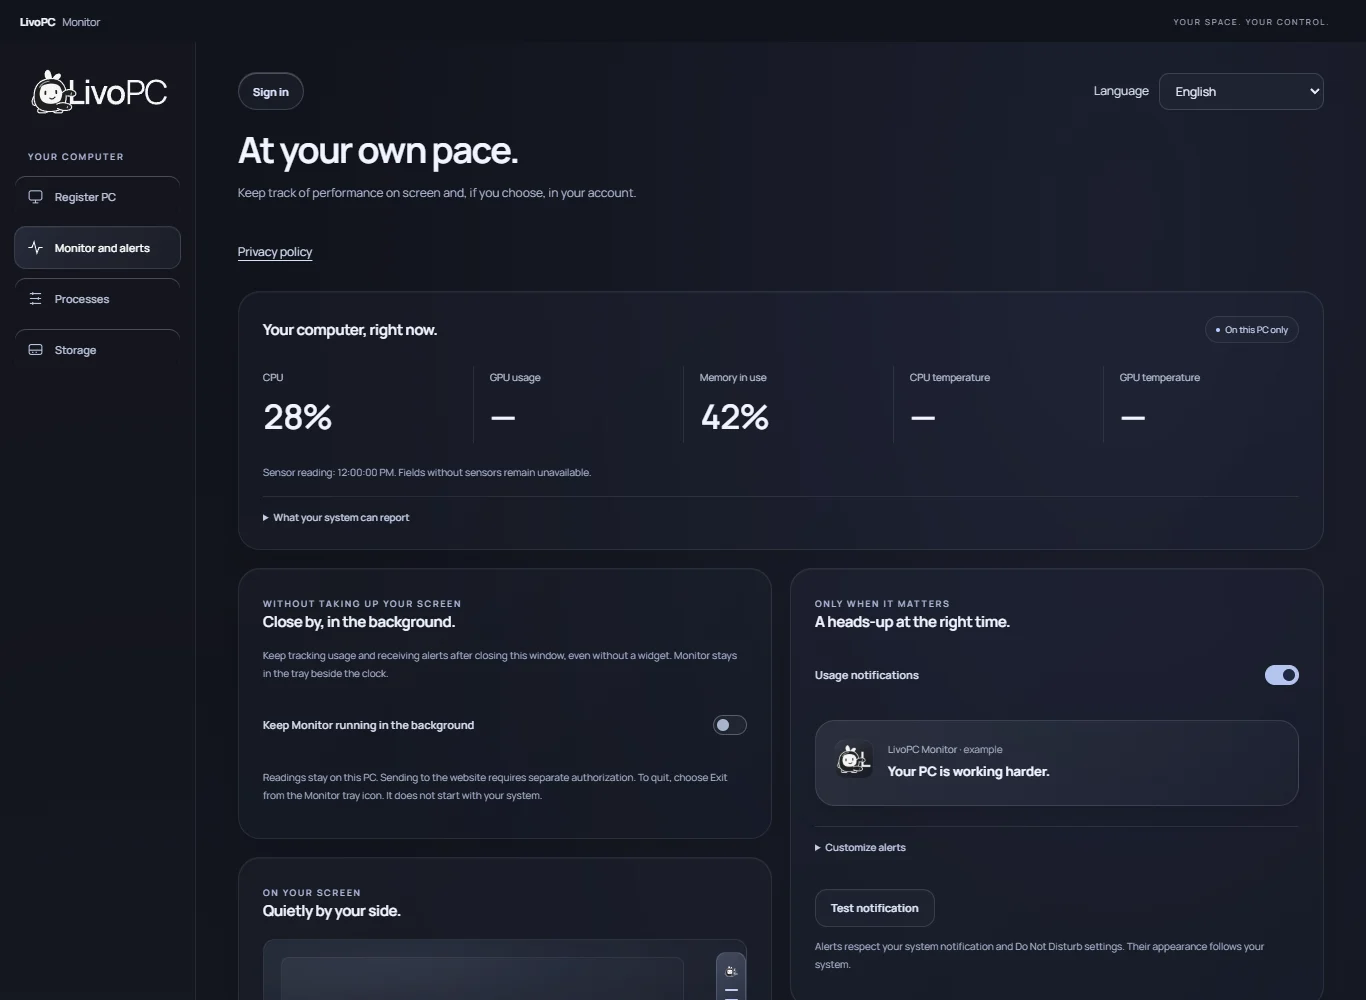 Enlarge screenshot

Download LivoPC Monitor
Install on Windows through Microsoft Store and get updates there. macOS and Linux are coming later.
Download the app
Choose the version for your computer.

Installation and updates through Microsoft Store. Opens in a new tab.
Other systems
Downloading the app does not require an account. To register your PC, review the components in Monitor and confirm your account in the browser.
Version 1.11 in certification Version 1.11 brings the new name, a standalone overlay without Game Bar, optional FPS and layout, color and transparency settings. It has been submitted to Microsoft Store and awaits approval. The download button opens the published version, which may still be named Connect and may not include these features.
One PC. Many ways to use it.
Understand what happens during your work or play before deciding what to close, adjust or replace.
Gaming and streaming
Track available CPU, RAM and GPU readings while gaming. Version 1.11 offers optional FPS and a customizable overlay. Use borderless window mode; exclusive fullscreen may prevent display. It does not promise performance gains.
Programming and development
Watch resource usage with your IDE, browser, builds and containers running. Process rankings help you investigate which programs are using the most CPU or memory at that moment.
Local AI and AI tools
When running local models, track RAM and the GPU and VRAM readings your system exposes. For cloud AI services, Monitor observes your computer, not resource usage on remote servers.
3D modeling and rendering
Track CPU, memory and available sensors during scenes, simulations and renders. See usage while work happens; Monitor does not estimate render time or recommend hardware based on a single spike.
Editing and demanding software
Use monitoring during video editing, CAD and multitasking. Check memory and available space. Large-file analysis helps you review storage without deleting anything automatically.
Take a look inside Monitor
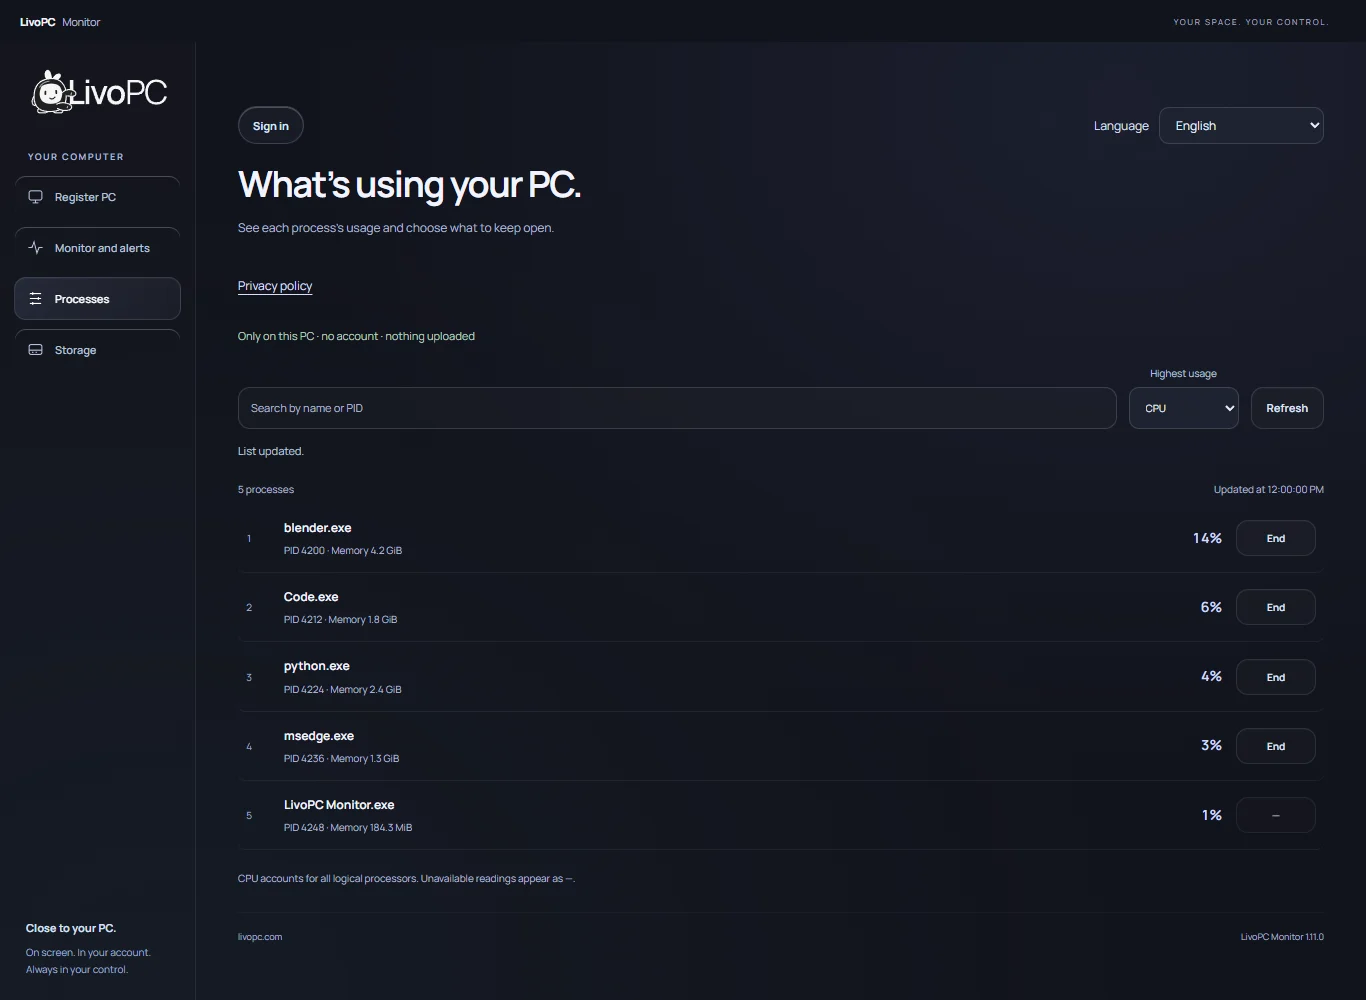
Version 1.11 interface with sample data. The update is in Microsoft Store certification. Open an image to see the details.
 Enlarge screenshot
Processes, ranked by usage
On Windows, sort by CPU, memory, I/O and available GPU readings. Open from the app, widget shortcuts or a CPU, memory or GPU alert. Ending a process requires confirmation and may lose unsaved work.
Version 1.11 interface · sample data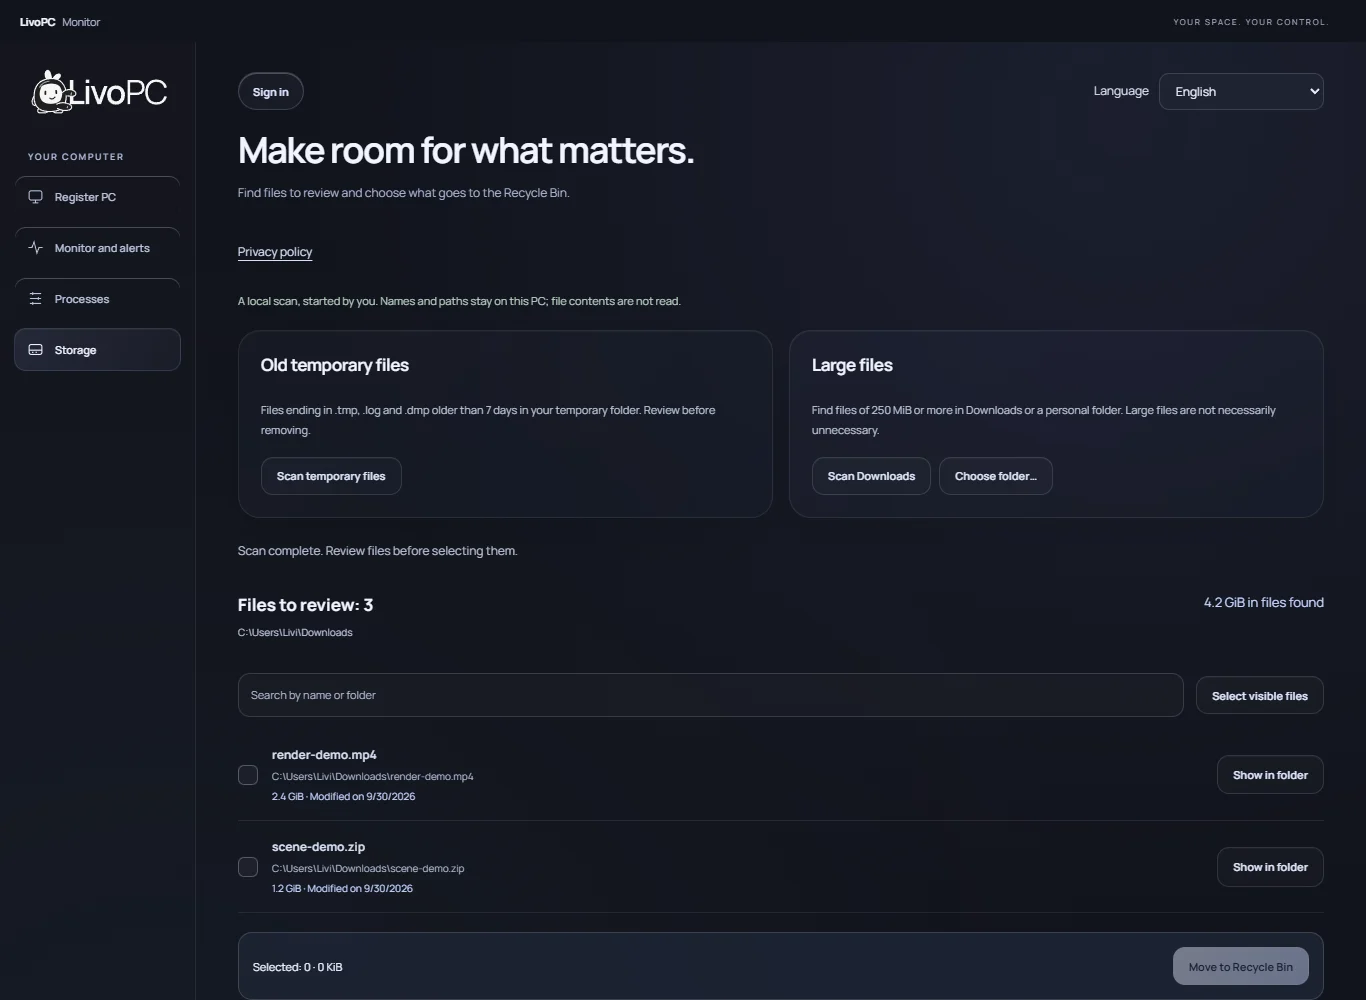 Enlarge screenshot
Storage under your control
Scan old temporary files or files of at least 250 MiB in a personal folder. Review, select and confirm before moving them to the Recycle Bin. Large does not mean unnecessary; nothing is removed automatically.
Version 1.11 interface · sample data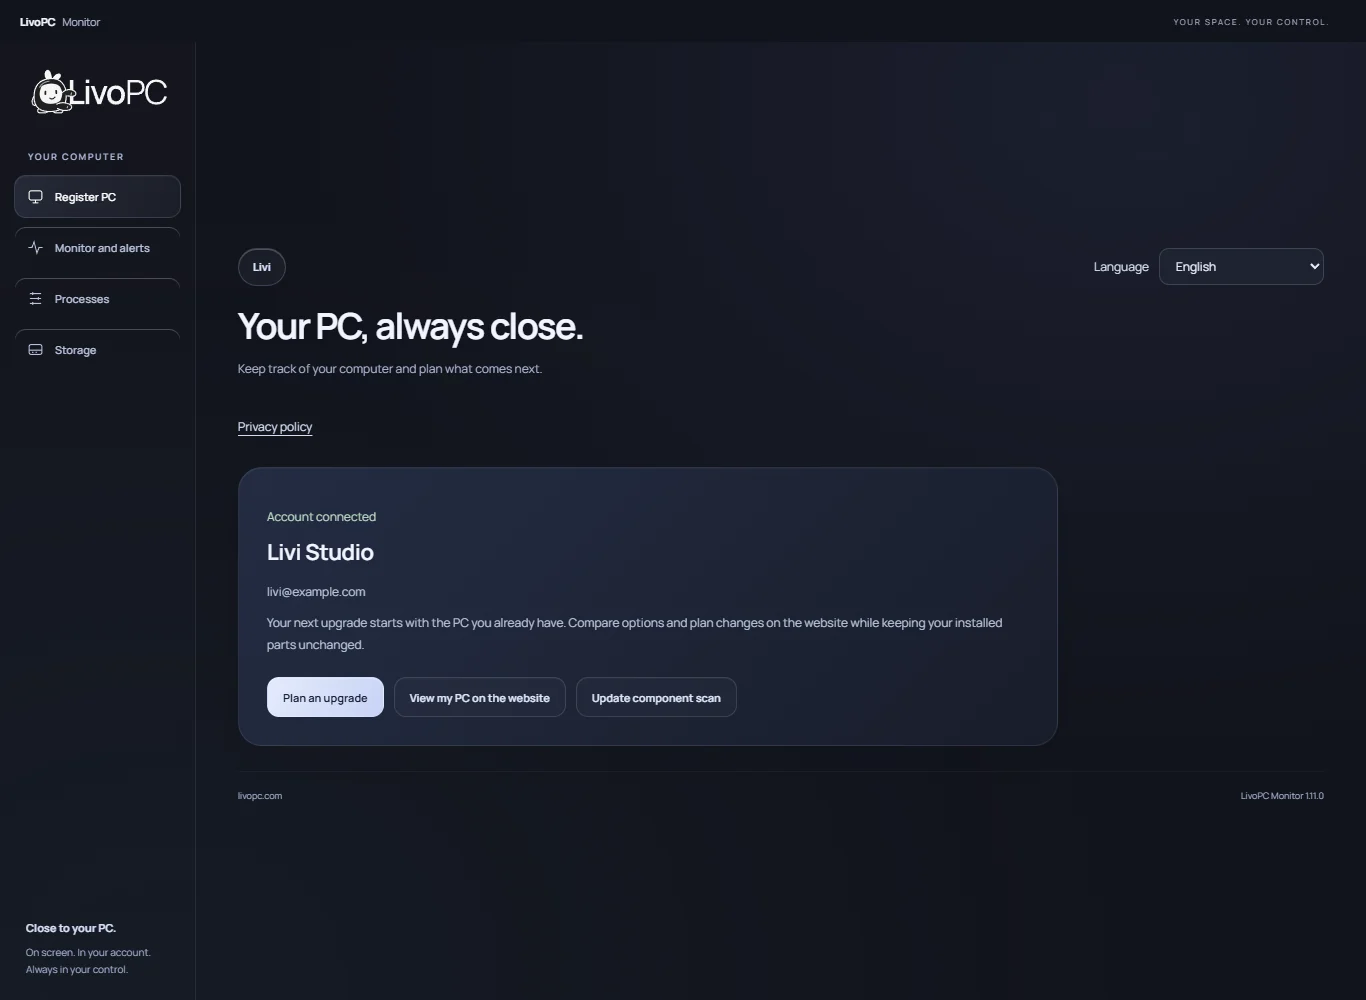 Enlarge screenshot
Find your PC. Plan your next step.
Connect your account in the browser and choose an existing PC, including after reinstalling. Your account can stay connected when you reopen the app, protected by the system vault. Plan upgrades on the website; installed components change only after review and confirmation.
Version 1.11 interface · sample dataAssisted registration
Review the detected components and confirm your account in the browser. New PCs start private; changes to an existing PC require review.
Resource monitoring
Track CPU usage, memory and readings exposed by your system. Temperatures and GPU metrics depend on hardware, drivers and sensors.
Alerts that respect your pace
Usage alerts at 90% and 99% by default, with configurable thresholds, minimum duration and a 10-minute cooldown for repeats at the same level. Keep the app in the background, even without a widget. Alerts respect Windows notification settings.
How to register your PC with LivoPC Monitor
- On the computer you want to register, check the available installers for your platform and install Monitor.
- Open the app, authorize detection and review the components it finds. You can fill in unidentified components later.
- Choose to connect your account. Sign in through the browser and confirm the account and destination; your password stays on the website.
- Confirm registration of a new private PC. If you selected an existing PC, review the components before applying changes.
Power supply, case and cooling may require manual entry. A detected name does not verify the exact model, ownership or component compatibility.
What can Monitor monitor?
- CPU and memory
- Total and per-logical-processor usage, RAM and uptime. System-reported clock speed and free space on the main volume, when available.
- Temperatures and GPU
- On Windows, additional sensors require LibreHardwareMonitor already running; on Linux, accessible hwmon sensors. NVIDIA may expose usage, temperature, VRAM and power through its driver. These readings are unavailable on macOS in this version.
- Disks and network
- Windows and Linux may expose disk read/write rates and physical network traffic. These rates are not benchmarks; Monitor does not yet provide these counters on macOS.
Local CPU and RAM update every 2 seconds. Sensors and authorized uploads use 10-second intervals; the website checks the latest reading every 5 seconds while visible. Missing readings stay unavailable, and delays can occur.
An overlay for gaming and work, without Game Bar
In version 1.11, overlay is the default mode when you enable the widget. Available CPU, RAM, GPU and temperature readings stay above other windows, while clicks pass through to the app in use. You choose which metrics appear.
Use Edit overlay or Ctrl+Shift+O to move and interact with the widget; finish editing to pass clicks back to the game. The app button remains available if the shortcut is taken. Prefer borderless window mode for games: exclusive fullscreen can hide the overlay.

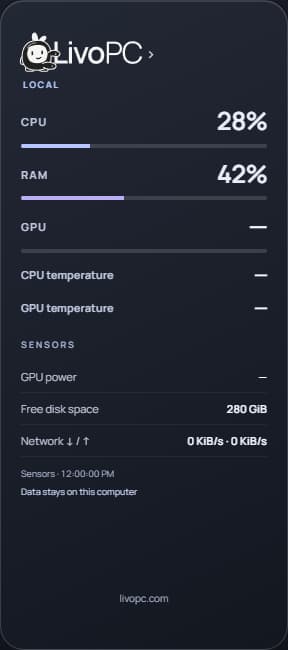
Layout, gradient and transparent background
In Customize overlay, preview the appearance before saving. Version 1.11 customization includes:
- Vertical or horizontal layout, size from 75% to 150% and metric order.
- Two gradient colors or a transparent background, keeping the readings visible.
- Save appearance to keep your choices, or restore the default in the preview before saving.
Optional FPS counter on Windows
Version 1.11 measures frame presentation by the foreground app using PresentMon. It reads what is happening locally rather than estimating performance from your graphics card model.
FPS starts off. Enable the widget and select FPS among the metrics. If Windows requires permission, use Authorize FPS reading and confirm the request. It remains your choice, and the app does not open this prompt automatically on restart.
Unsupported, unauthorized or stale readings display — instead of an invented value. Capture stops when you disable FPS, hide or minimize the widget, or exit the app. FPS monitoring does not improve performance or guarantee support for every game.
Your hardware, your permission
Registration and monitoring uploads require separate authorizations. To send readings to the website, confirm an account with a verified email and choose a PC you own.
Component detection does not read personal files, passwords or serial numbers. Process names, scanned file paths and FPS stay local and are not uploaded. Monitoring does not change installed components or publish your PC.
Uploaded readings stay private. Detail keeps one reading per minute for up to 24 hours. In PC usage, additional permission allows hourly summaries for up to 90 days, with hourly, daily, weekly and monthly filters. You can pause, delete history or unlink; unlinking also deletes readings for that connection.
Understand privacyPlatforms and availability
- Windows x64 · distribution through Microsoft Store. Component detection uses system facilities; extra sensors depend on available providers.
- Linux x64 · planned release, with distribution channel to be confirmed. Detection varies with utilities and permissions. Under Wayland, edge positioning requires a compatible X11/XWayland session.
- macOS Intel and Apple Silicon · planned release. Detects CPU, model, total memory and GPU; individual modules, disks and temperatures have limited or no coverage.
Available languages depend on your installed Monitor version. Detection has been checked on Windows; validation on physical Linux and macOS hardware is still pending. On mobile, you can browse this page and your account, but detection requires Monitor on the computer.
The current Windows version can be installed through Microsoft Store. The new name and version 1.11 features await certification; the store may display LivoPC Connect until release. macOS and Linux do not have public downloads yet.
Download MonitorQuestions about LivoPC Monitor
Does Monitor detect every PC component?
No. It reads what the system exposes. Power supply, case, cooler and unidentified models may need manual entry. Unknown data stays pending, without automatic compatibility approval.
Can I see CPU and GPU temperatures?
Only when a compatible sensor is available. On Windows, extra sensors use LibreHardwareMonitor already running; on Linux, hwmon. NVIDIA GPUs may expose temperature through the driver. Temperatures are unavailable on macOS in this version.
Do I need an account to use the widget?
Not for local-only mode. Saving registration and uploading monitoring data to the website require an account and confirmation. Upload permission can be revoked later.
Does the app run without telling me?
Monitor does not install a service or start automatically with Windows. You can enable background monitoring and alerts, even without a widget. Its icon stays in the tray; use Exit and stop monitoring to quit completely.
Can I install Monitor on my phone?
No. Monitor is a desktop app. Open the installation flow on the PC you want to register. You can check readings uploaded to your account from your phone.
Does Monitor improve FPS or speed up programs?
Monitor shows resource usage to help you investigate your PC. It is not a benchmark, automatic optimizer, antivirus or overclocking tool. High usage during a task can be expected; a single reading does not prove a bottleneck or justify replacing a component.
Does Monitor clean my SSD automatically?
No. Analysis starts when you request it. The app lists old temporary files or large files in the chosen scope without reading their contents. You select the items and confirm moving them to the Recycle Bin. There is no registry cleaning or automatic removal.
Does the overlay appear in fullscreen games?
Prefer windowed or borderless window mode. Exclusive fullscreen can prevent an external window from appearing above the game. Monitor does not inject code into games and does not promise support for every display mode or anti-cheat system. Battlefield still needs validation on the configuration being used.
Is FPS saved in website history?
No. FPS, the measured app’s name and frame samples stay only in local memory during capture. Account history contains only general metrics uploaded with your permission; it does not include FPS or process history.
Your next step starts with your PC
Product documentation · updated on .
Sources, limitations and corrections